Which Metrics are Available on QRCodeDynamic's Link Statistics
There are various metrics on QRCodeDynamic's statistics page that can help you get a better understanding of your audience and who clicks your links.
By analyzing these metrics, you can measure the effectiveness of your campaigns and make informed decisions.
In this guide, we will explain the metrics that are available on the statistics page, helping you understand the data and how to utilize it effectively.
Let's dive into them!
Step 1: Login and go to the "Dashboard"
Step 2: Click the "Links" button as shown below
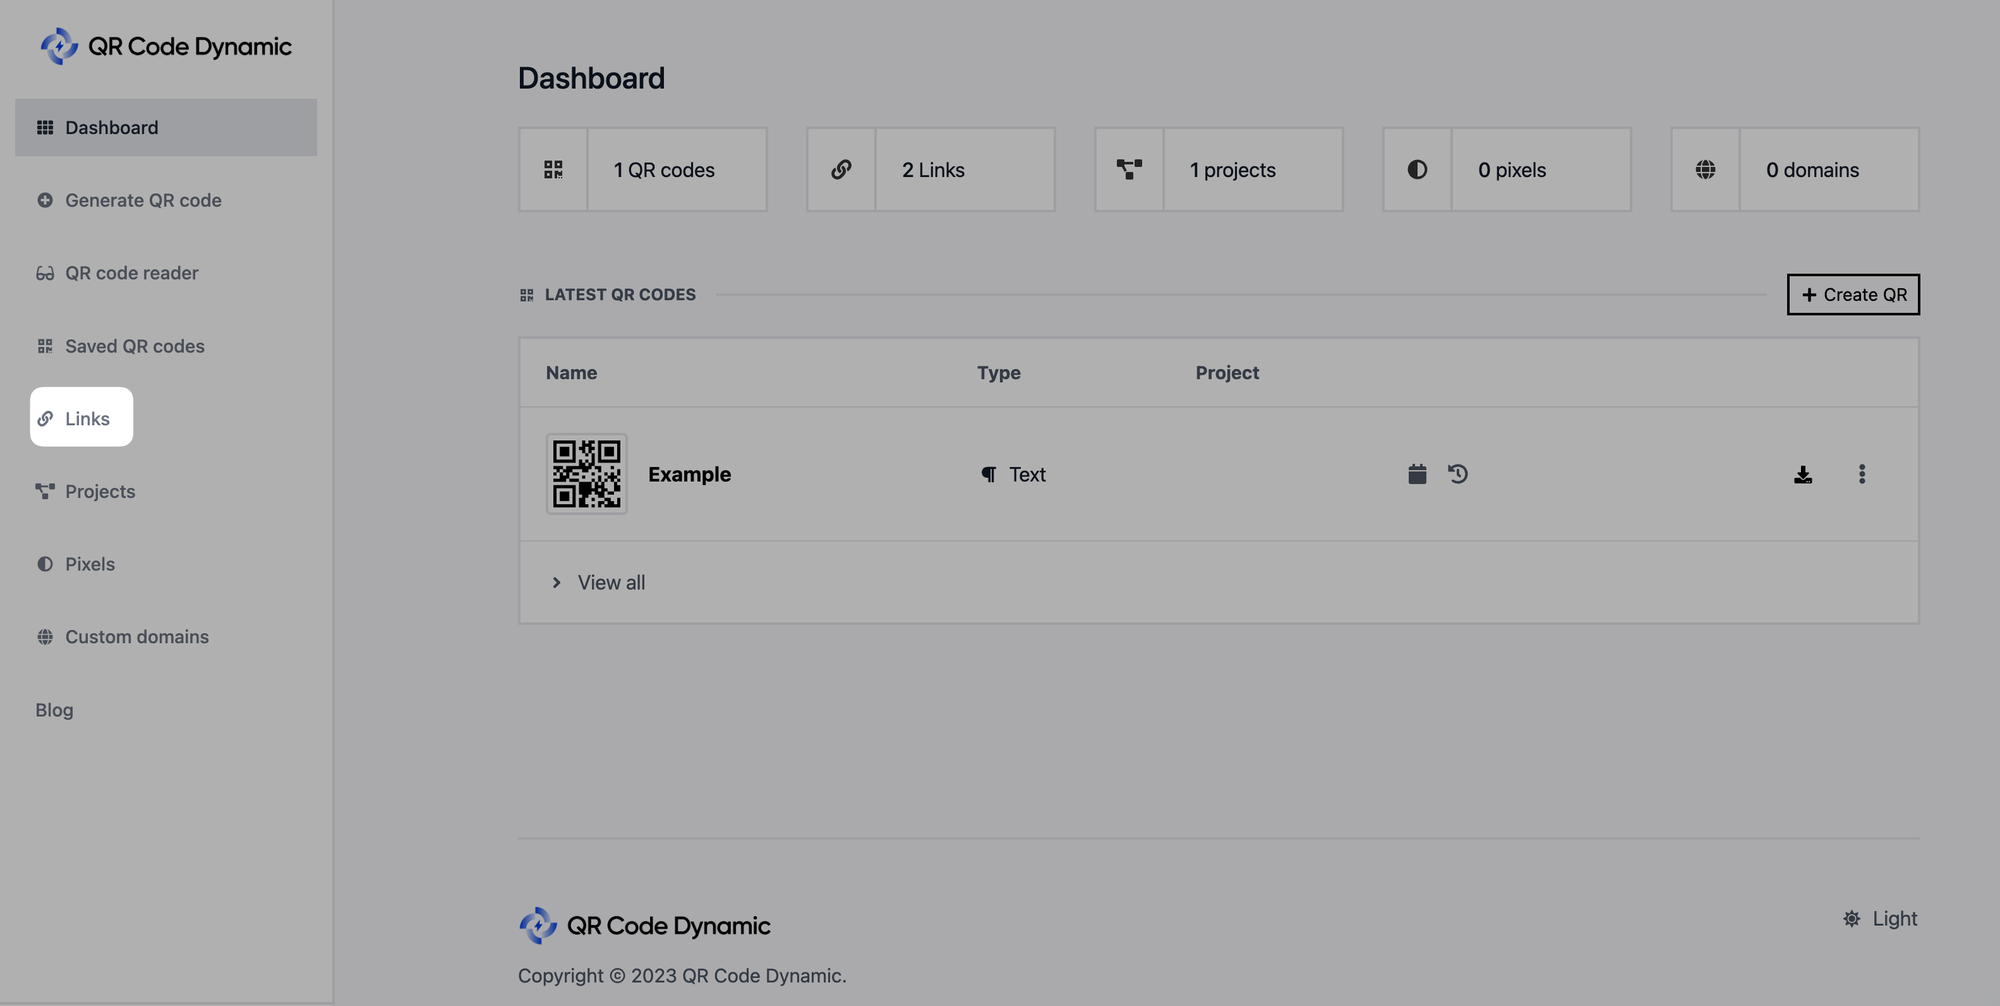
Since you embed links in them, you can only track how well URL QR codes perform.
Step 3: Select "Stats" as indicated below.
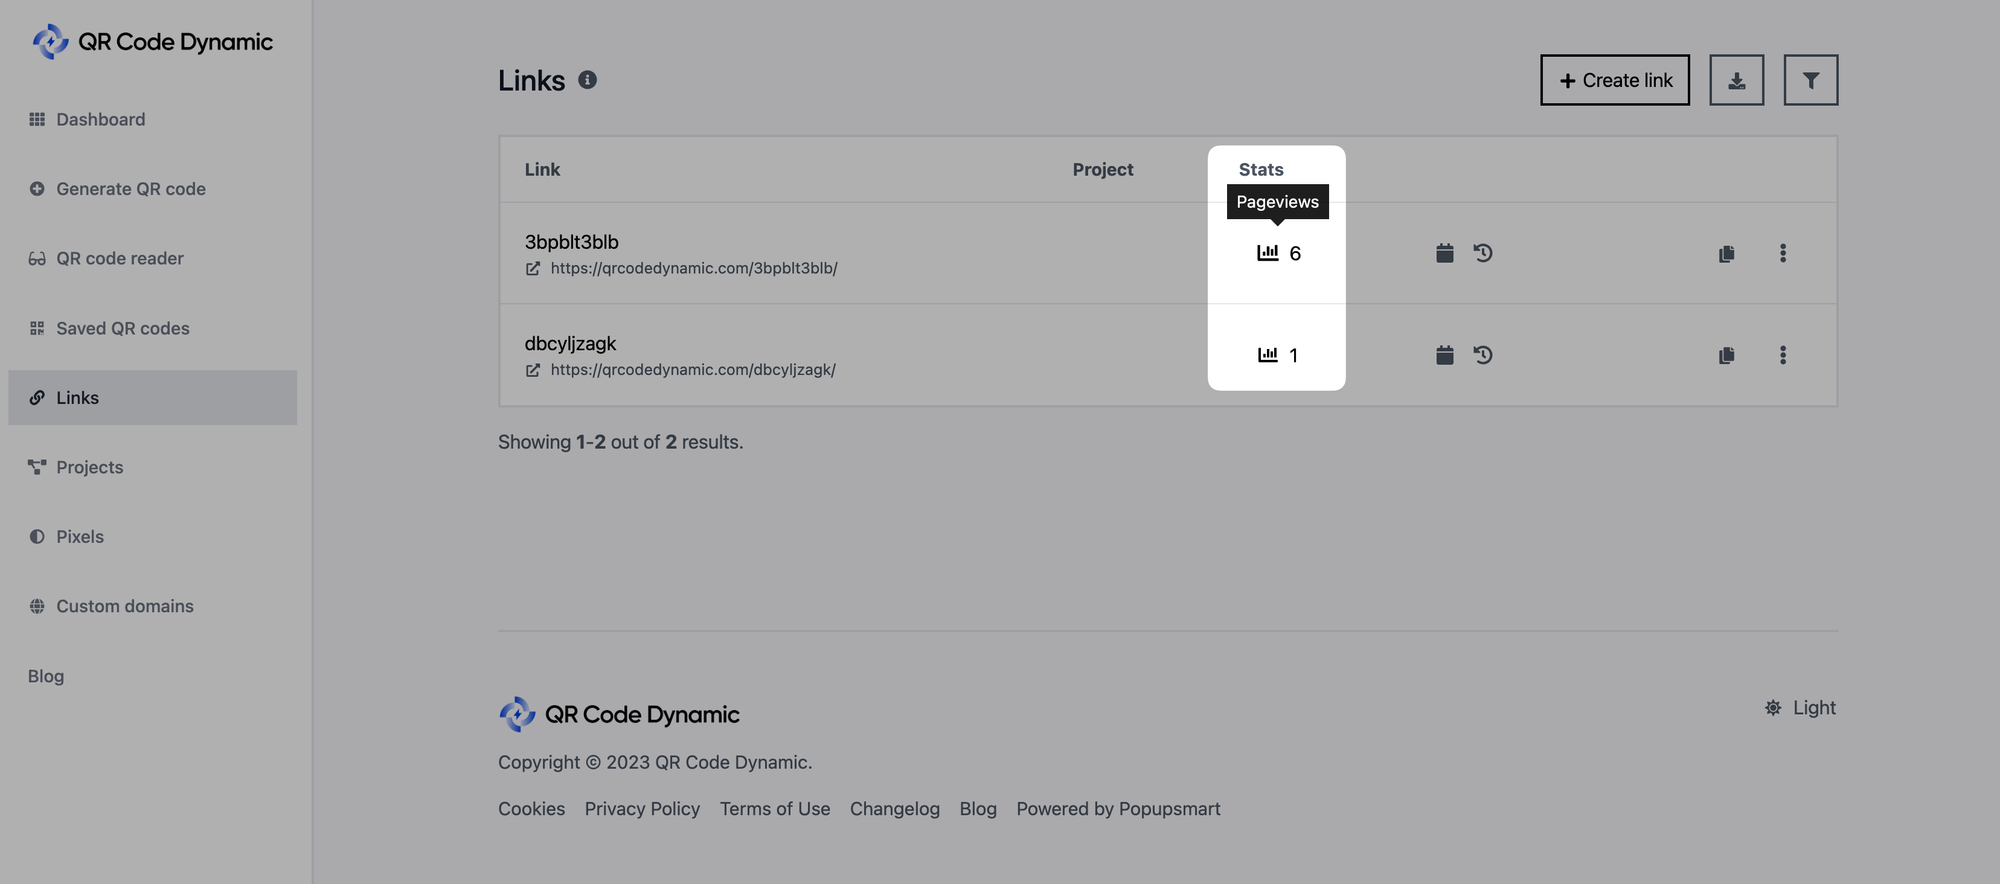
Under the "Stats" column, you can see how many times your QR code links have been seen. To learn more about the statistics for your links, click the symbol.
Step 4: Explore an overview of your links' statistics & available metrics
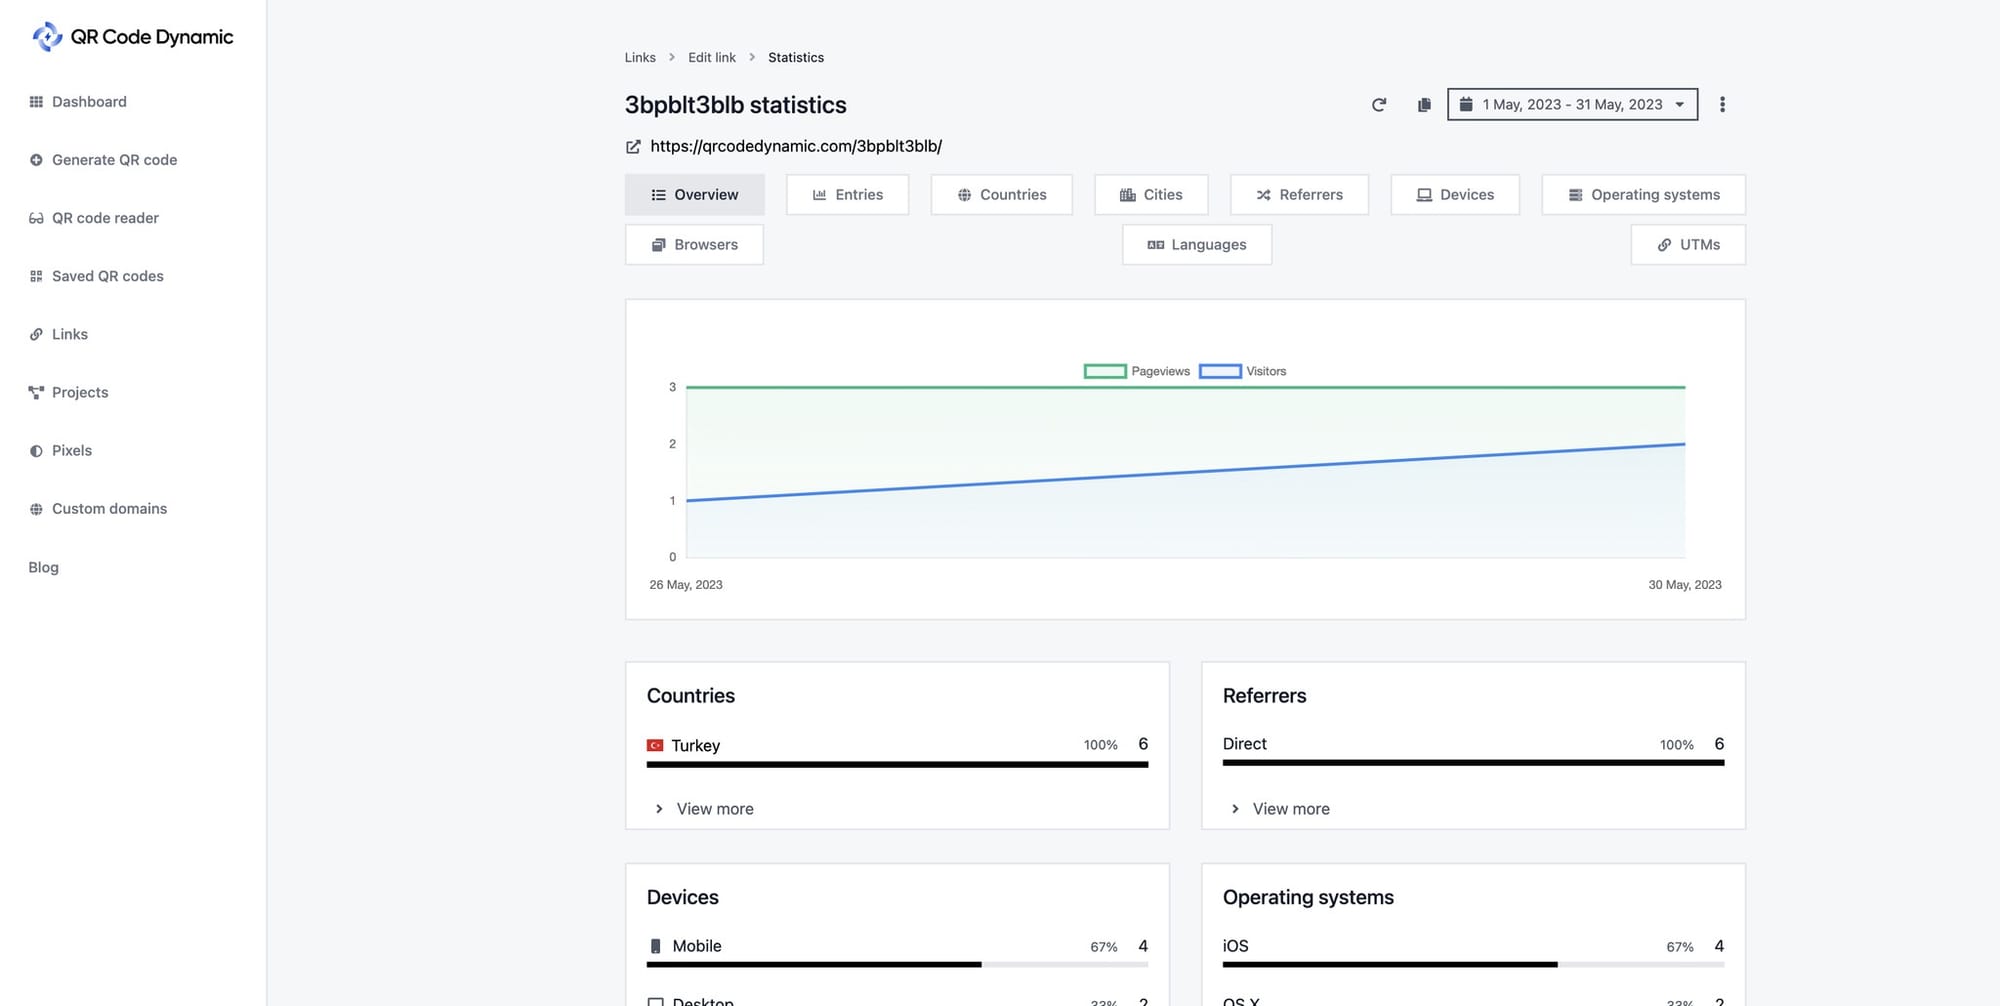
Once you click "Stats," you will be redirected to the overview of your links. You can dive into their details by clicking each metric.
Here are the available metrics on link statistics:
Entries
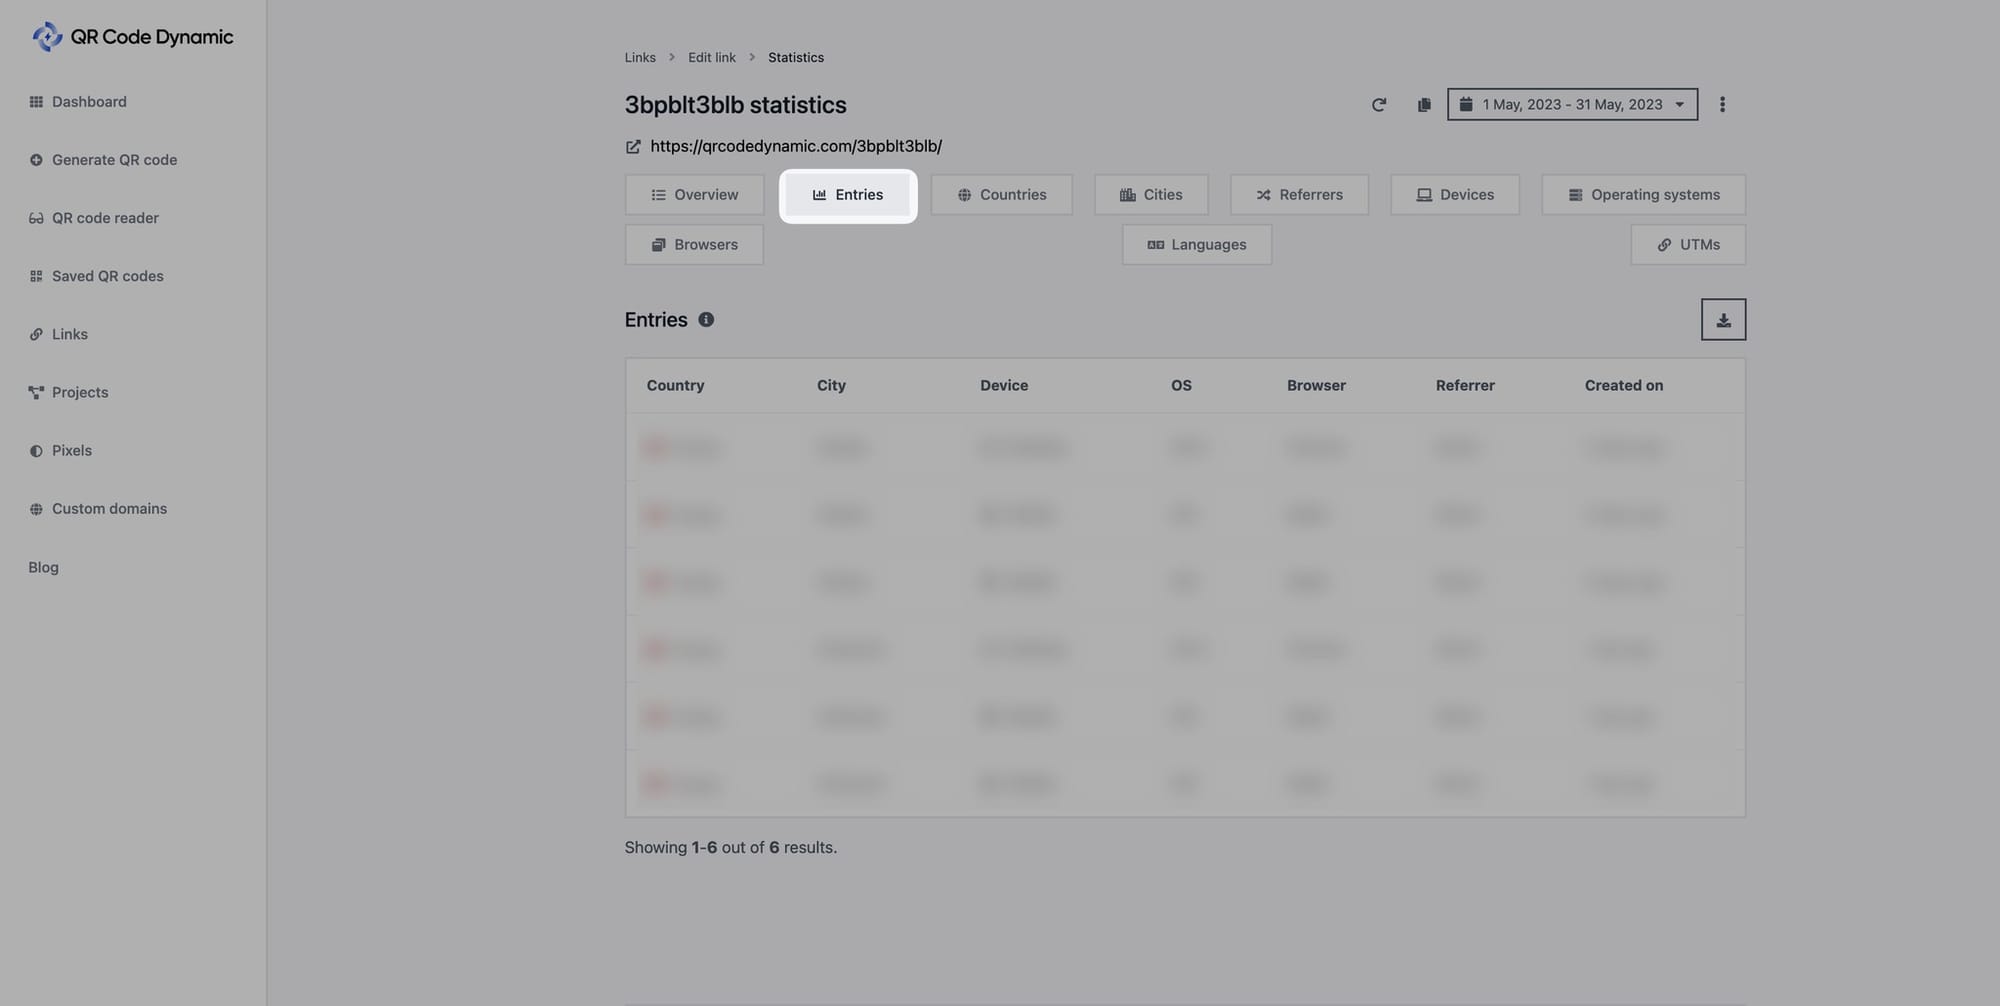
The entries part displays all the entries that have been logged in a compact list.
Countries
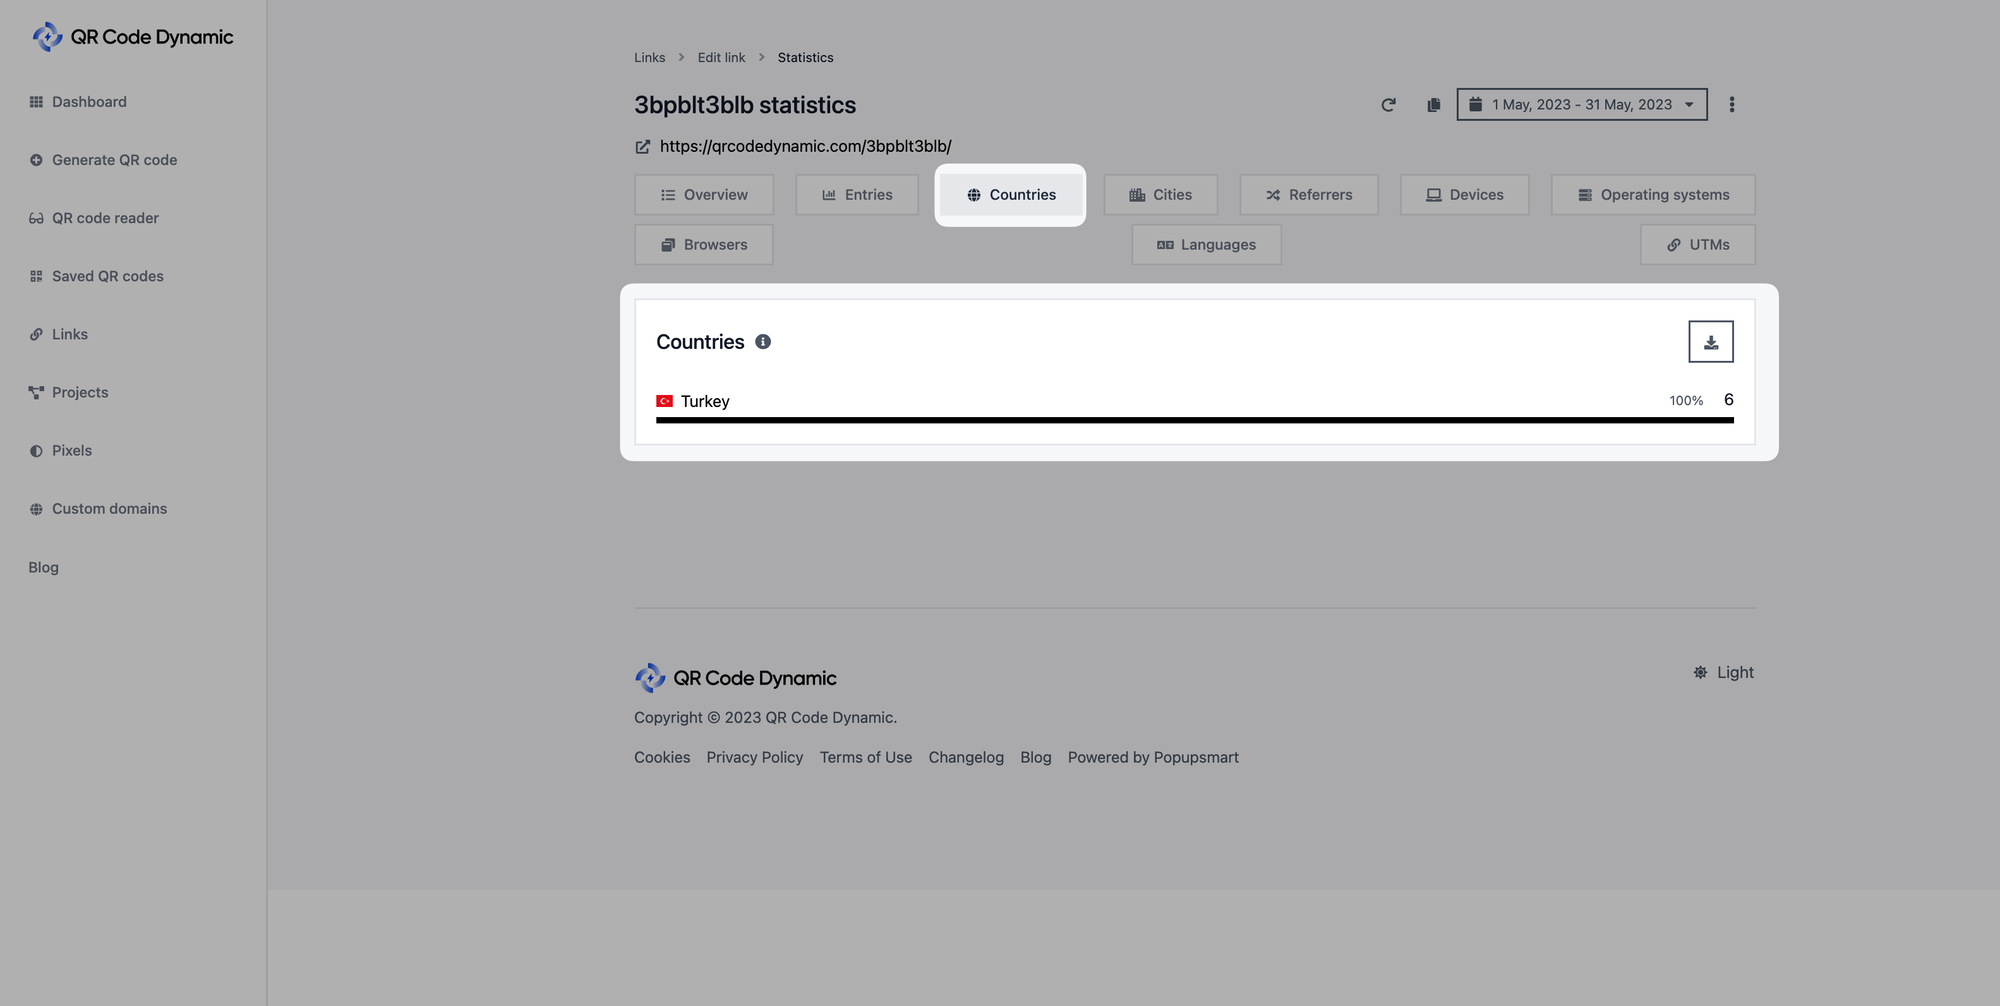
The countries part shows what countries your visitors are from.
Cities
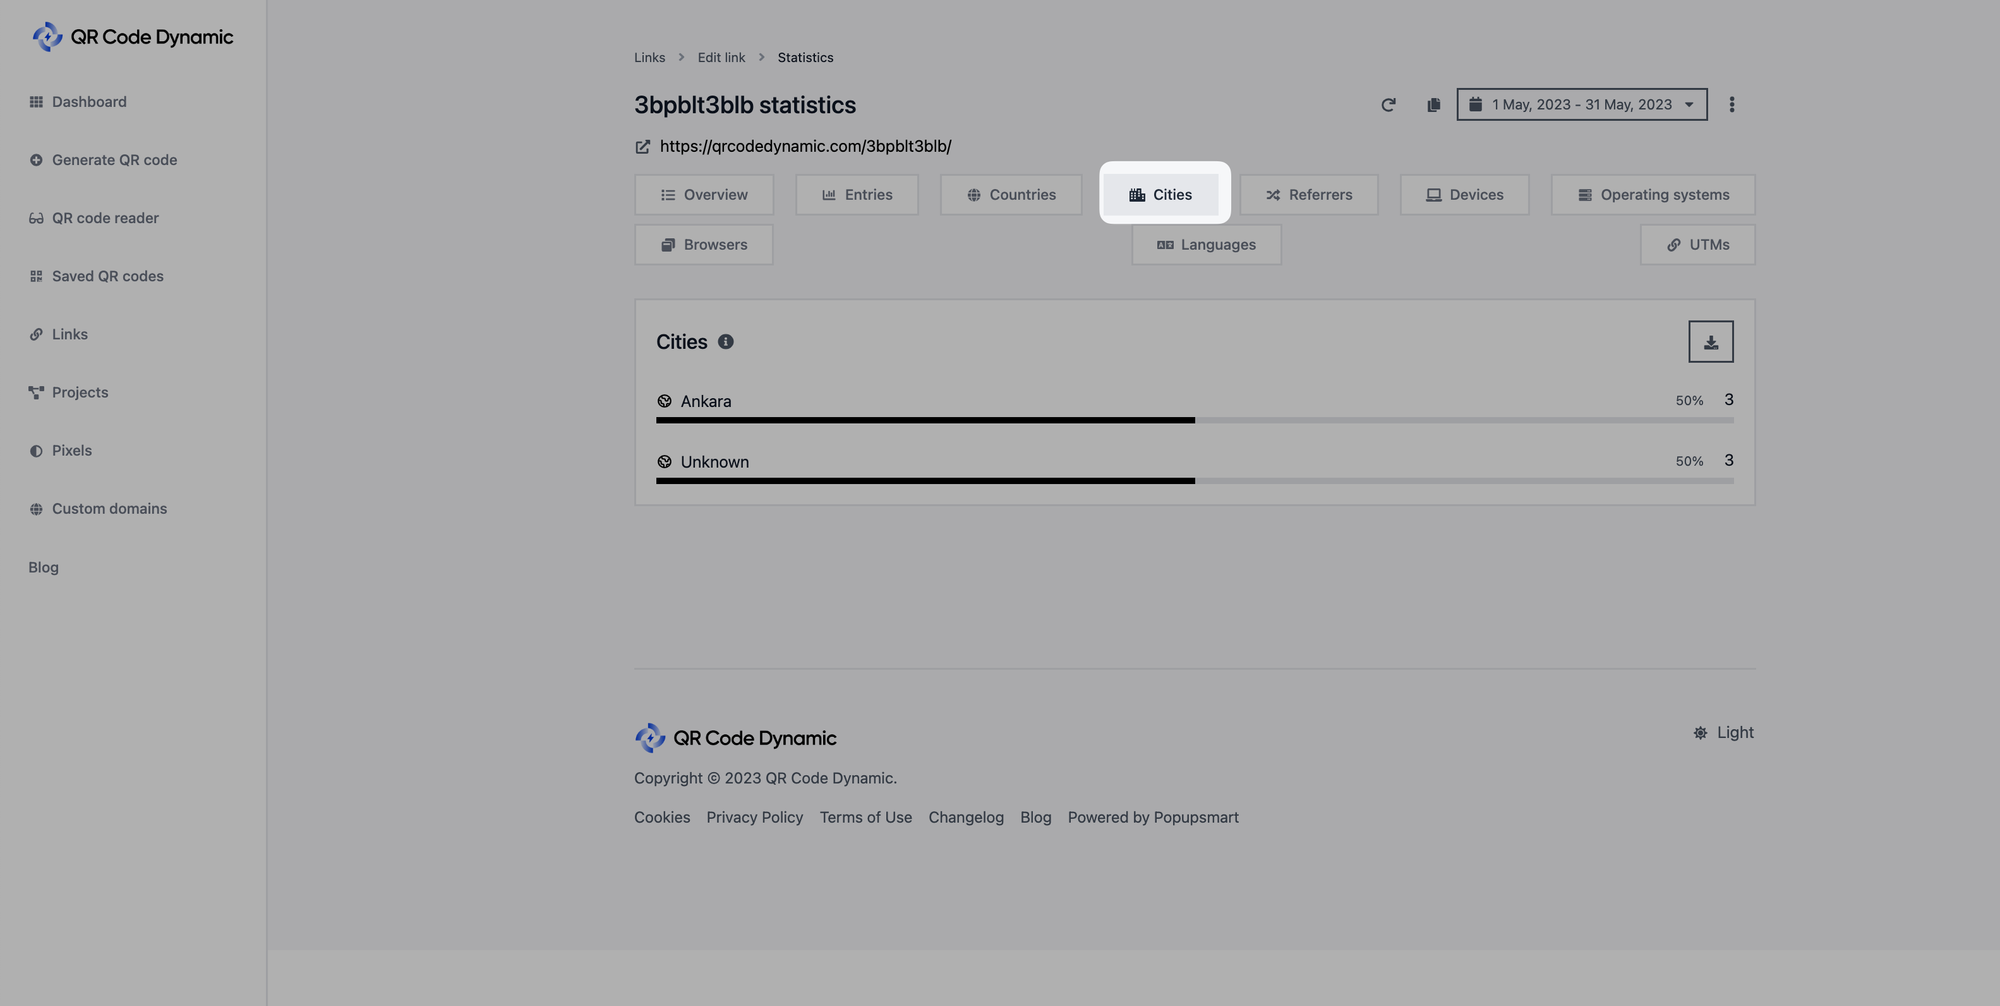
The cities part shows the cities your visitors are from.
Referrers
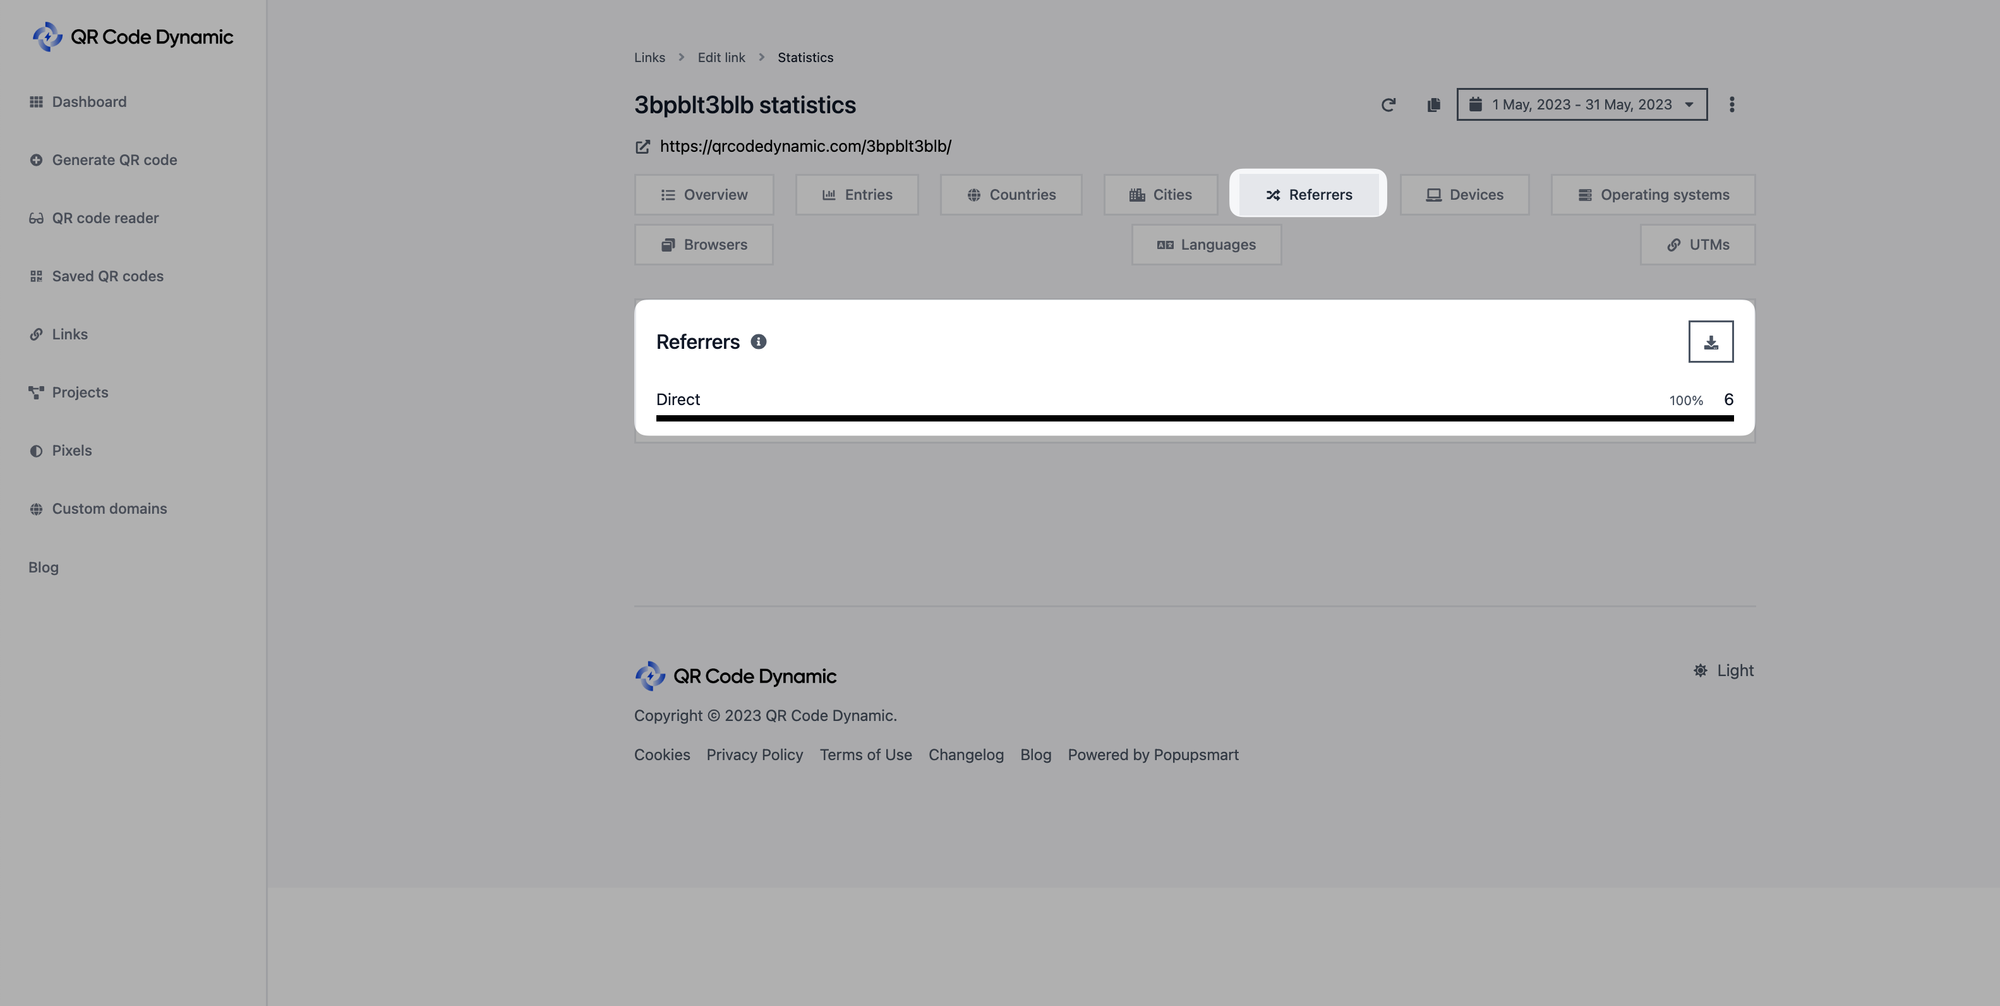
The referrers part displays where your traffic comes from.
Devices
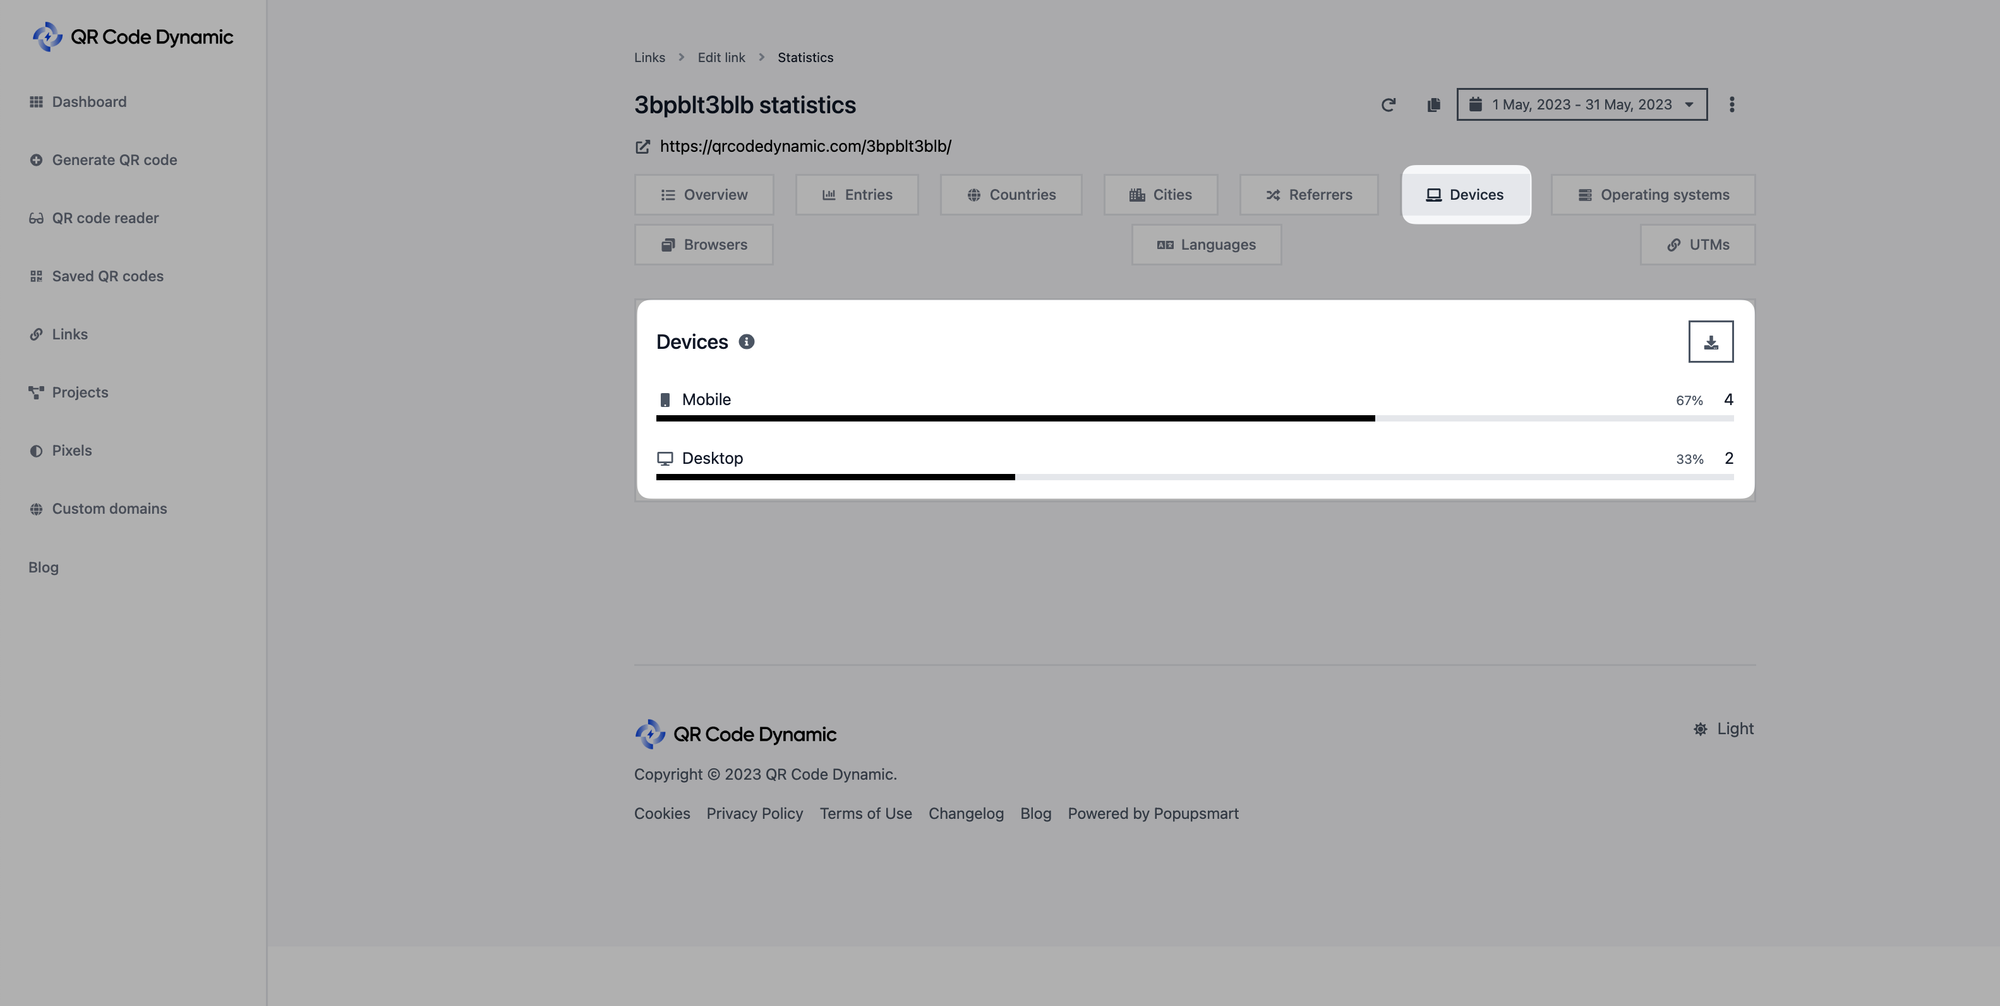
The devices section shows the devices that your audience uses.
Operating Systems
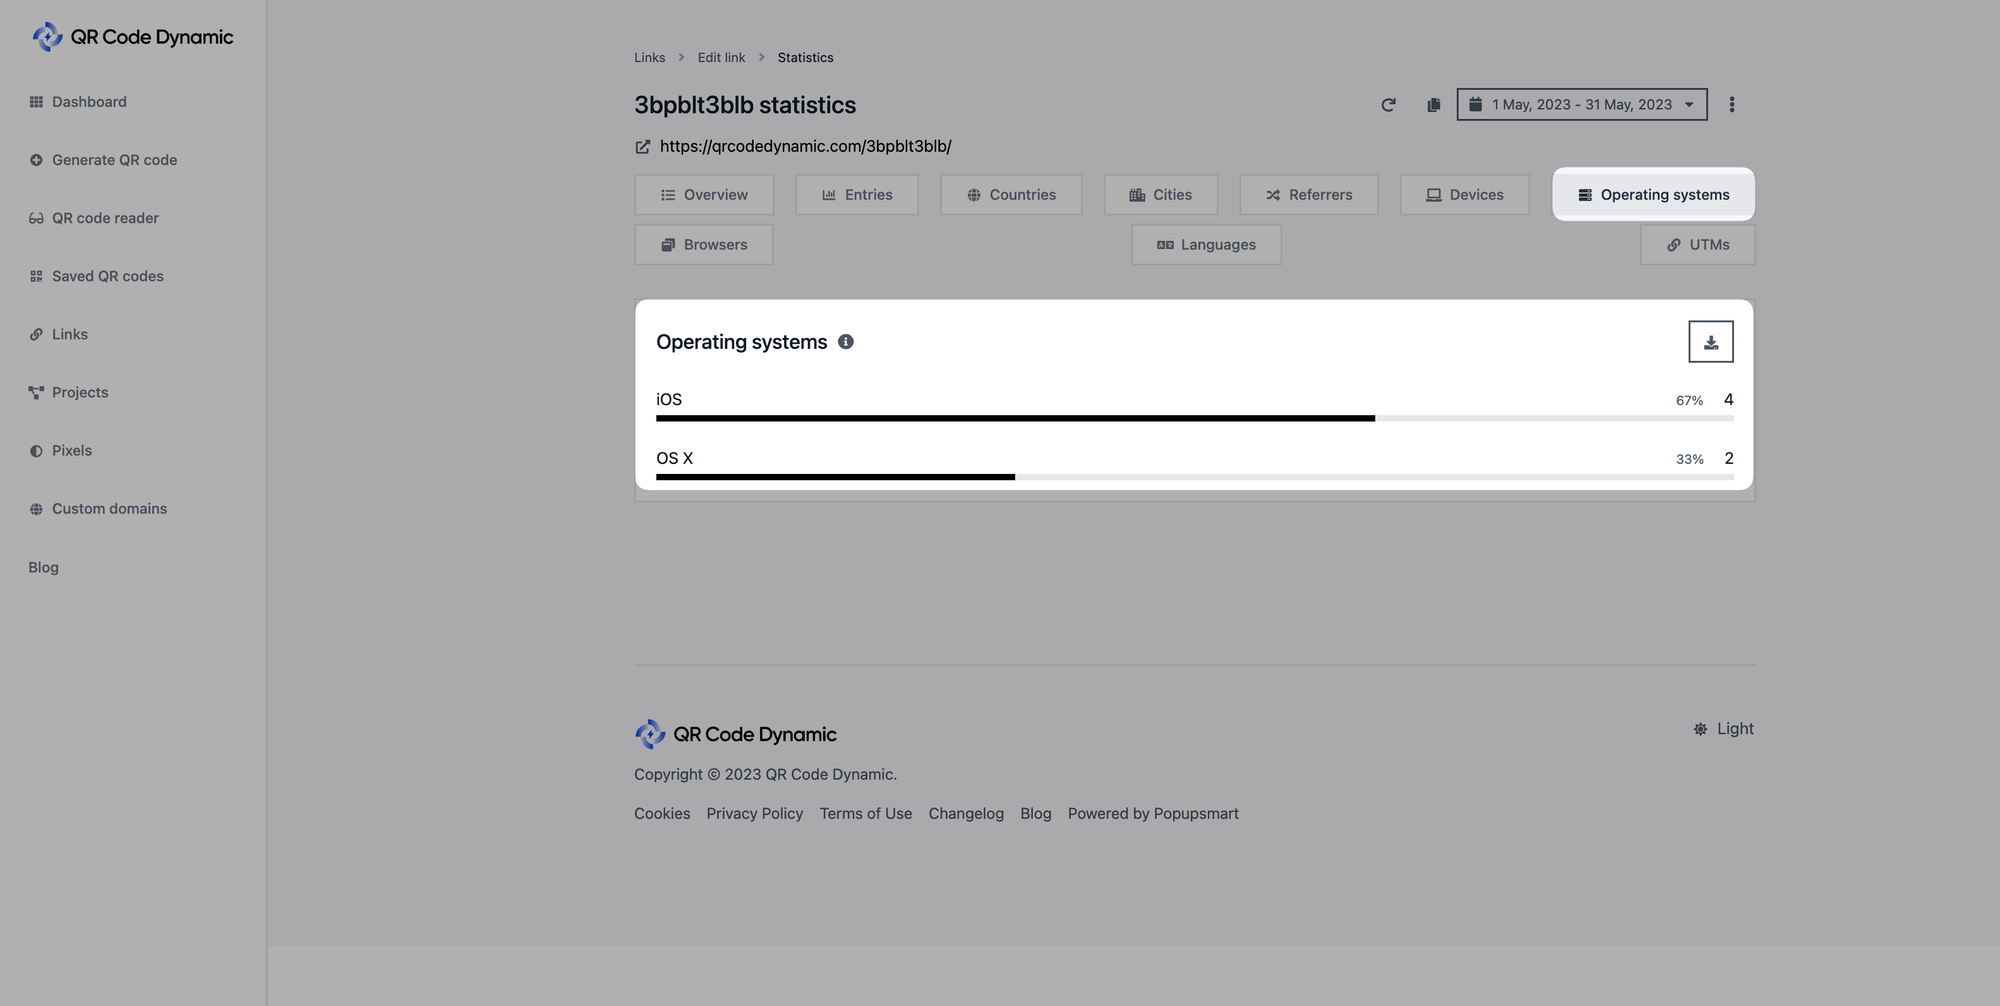
The operating systems part displays the operating systems your visitors use.
Browsers
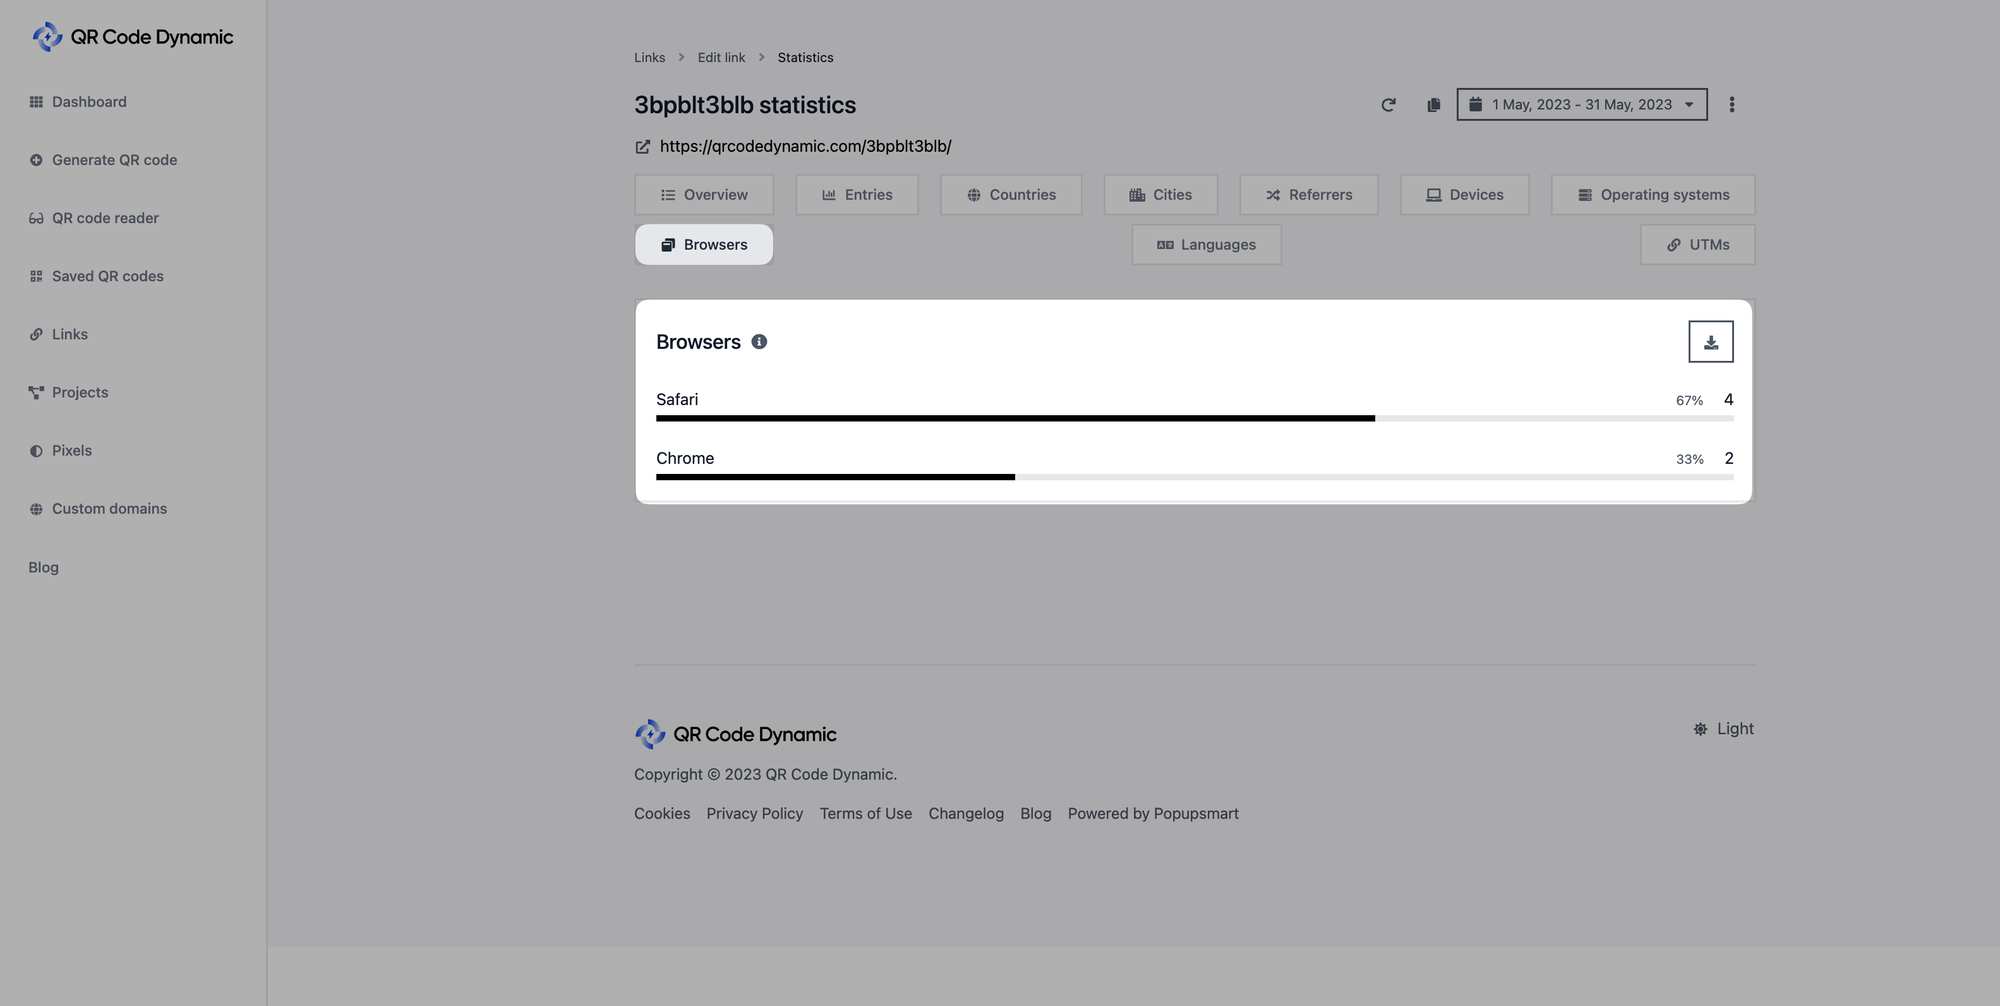
The browsers section shows which browsers your audience uses.
Languages
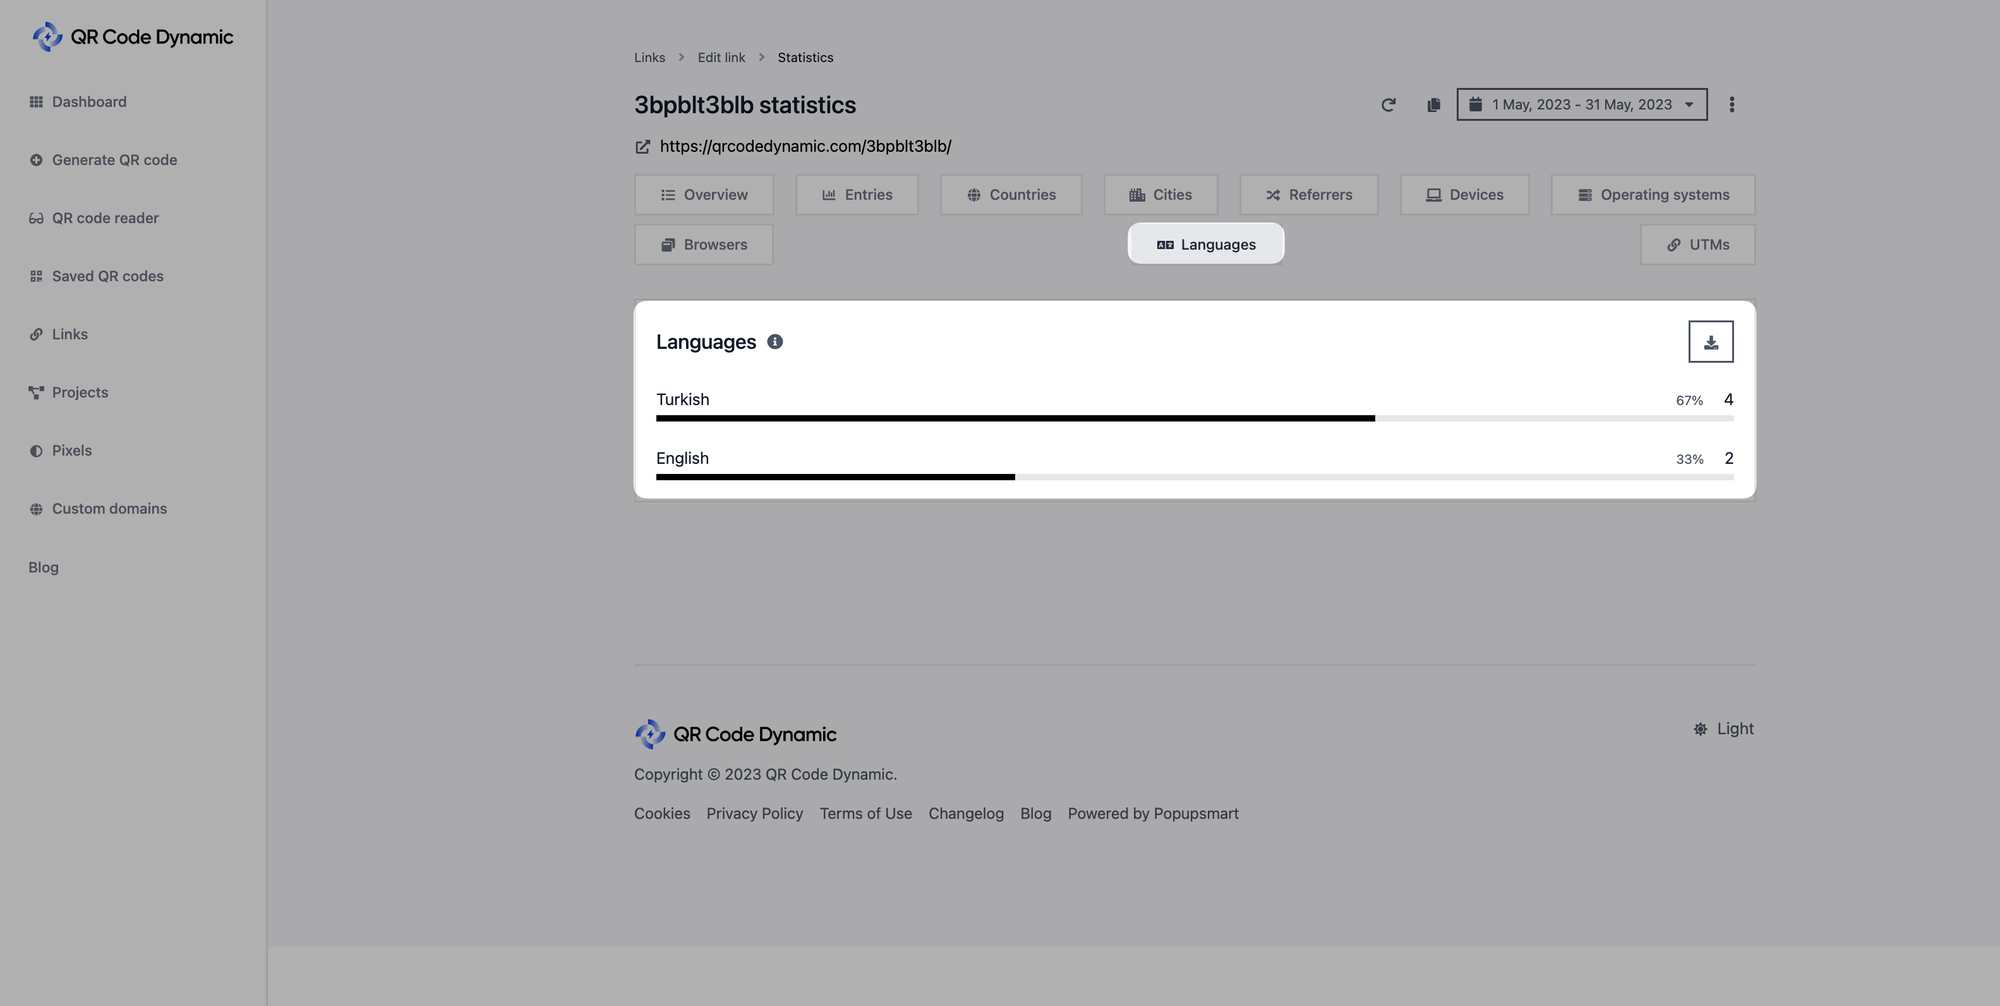
The languages part displays the browser languages your visitors use.
UTMs
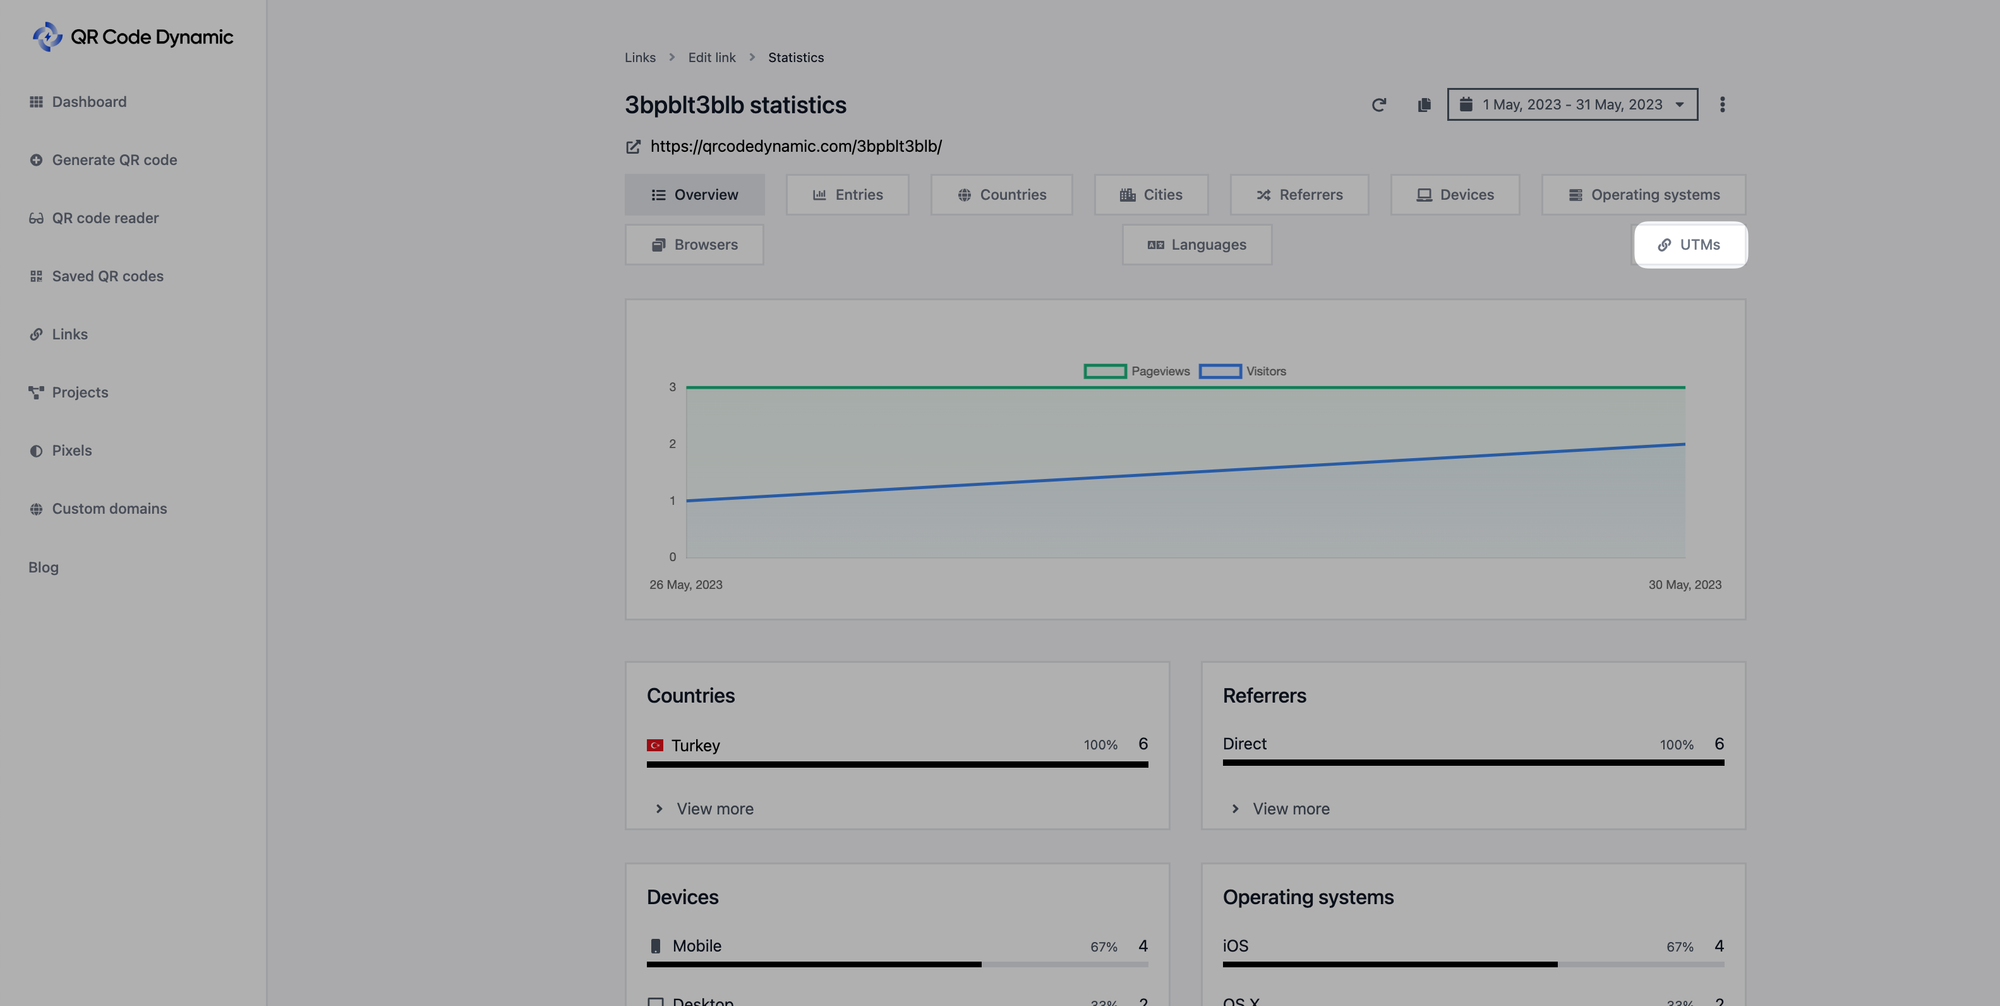
UTMs show the UTM details of your links.
Step 5: Filter your link statistics
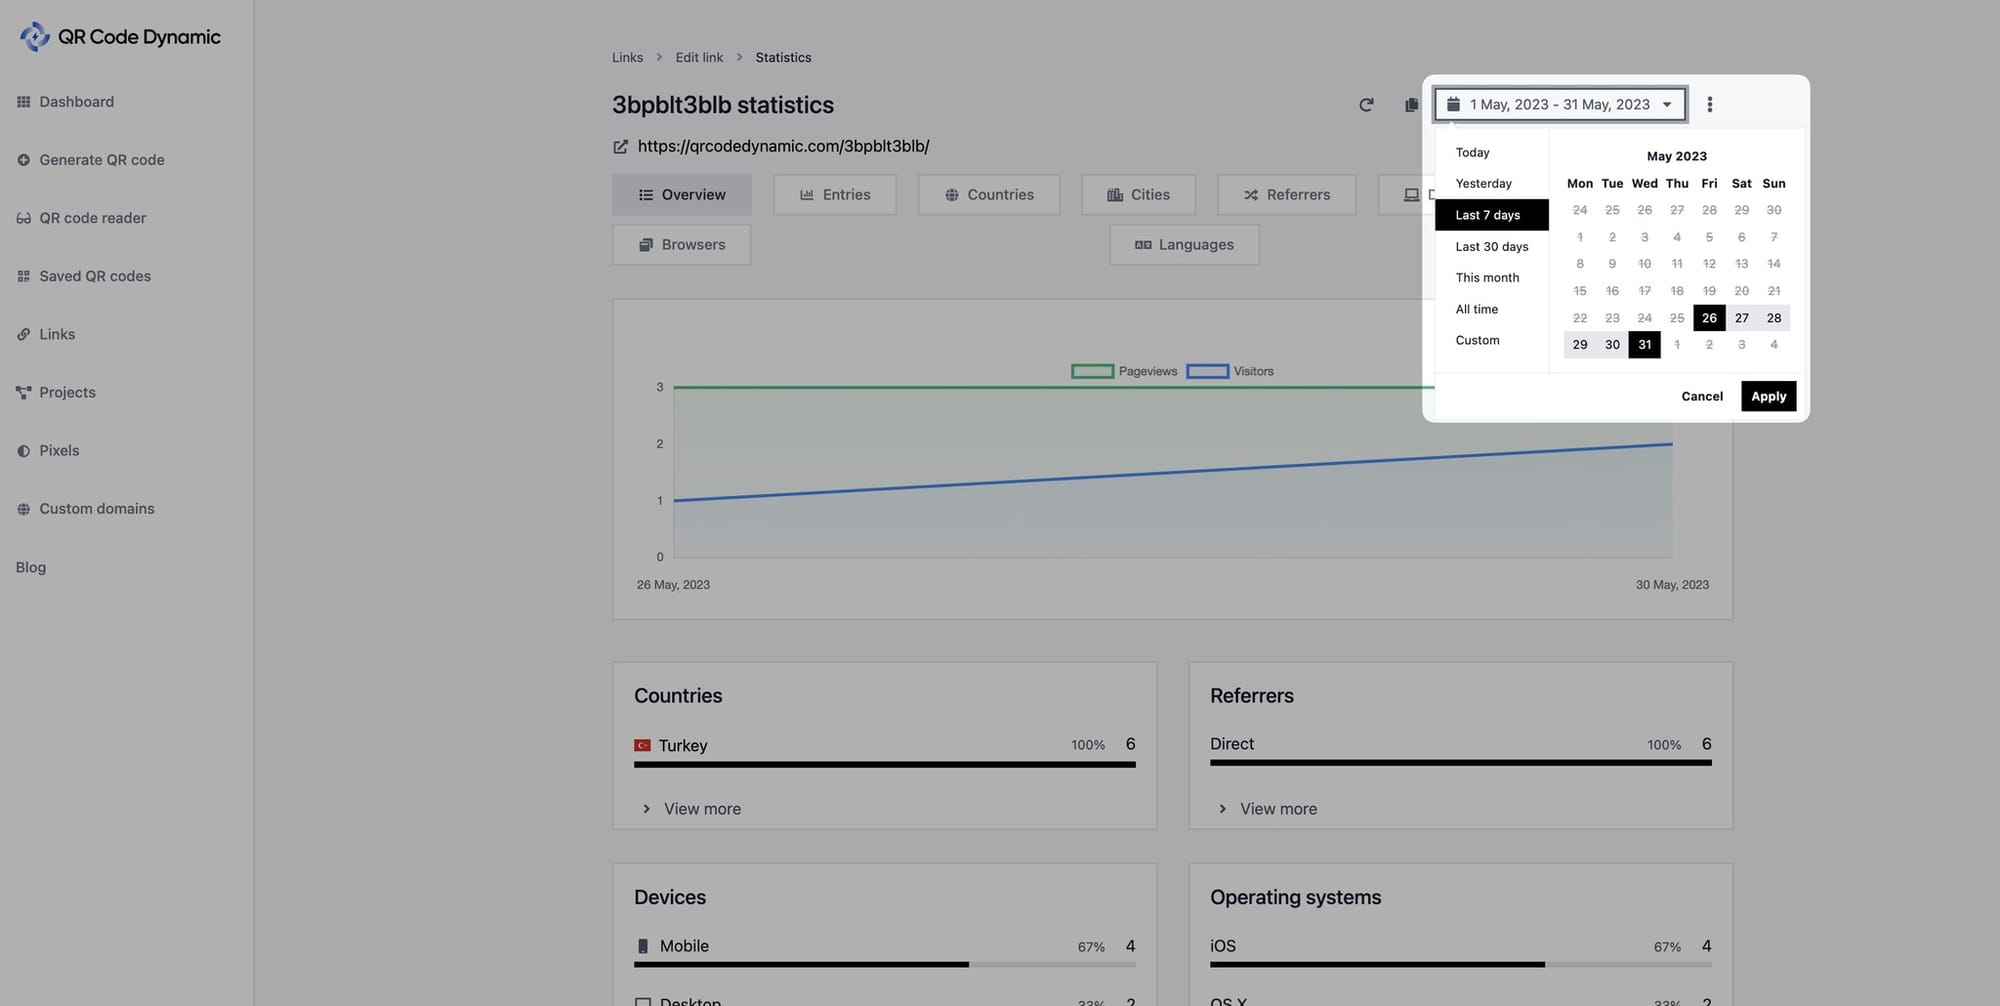
You can filter the date range of your links, as shown below, to analyze the performance of links during a certain period of time.
Step 6: Export your link statistics
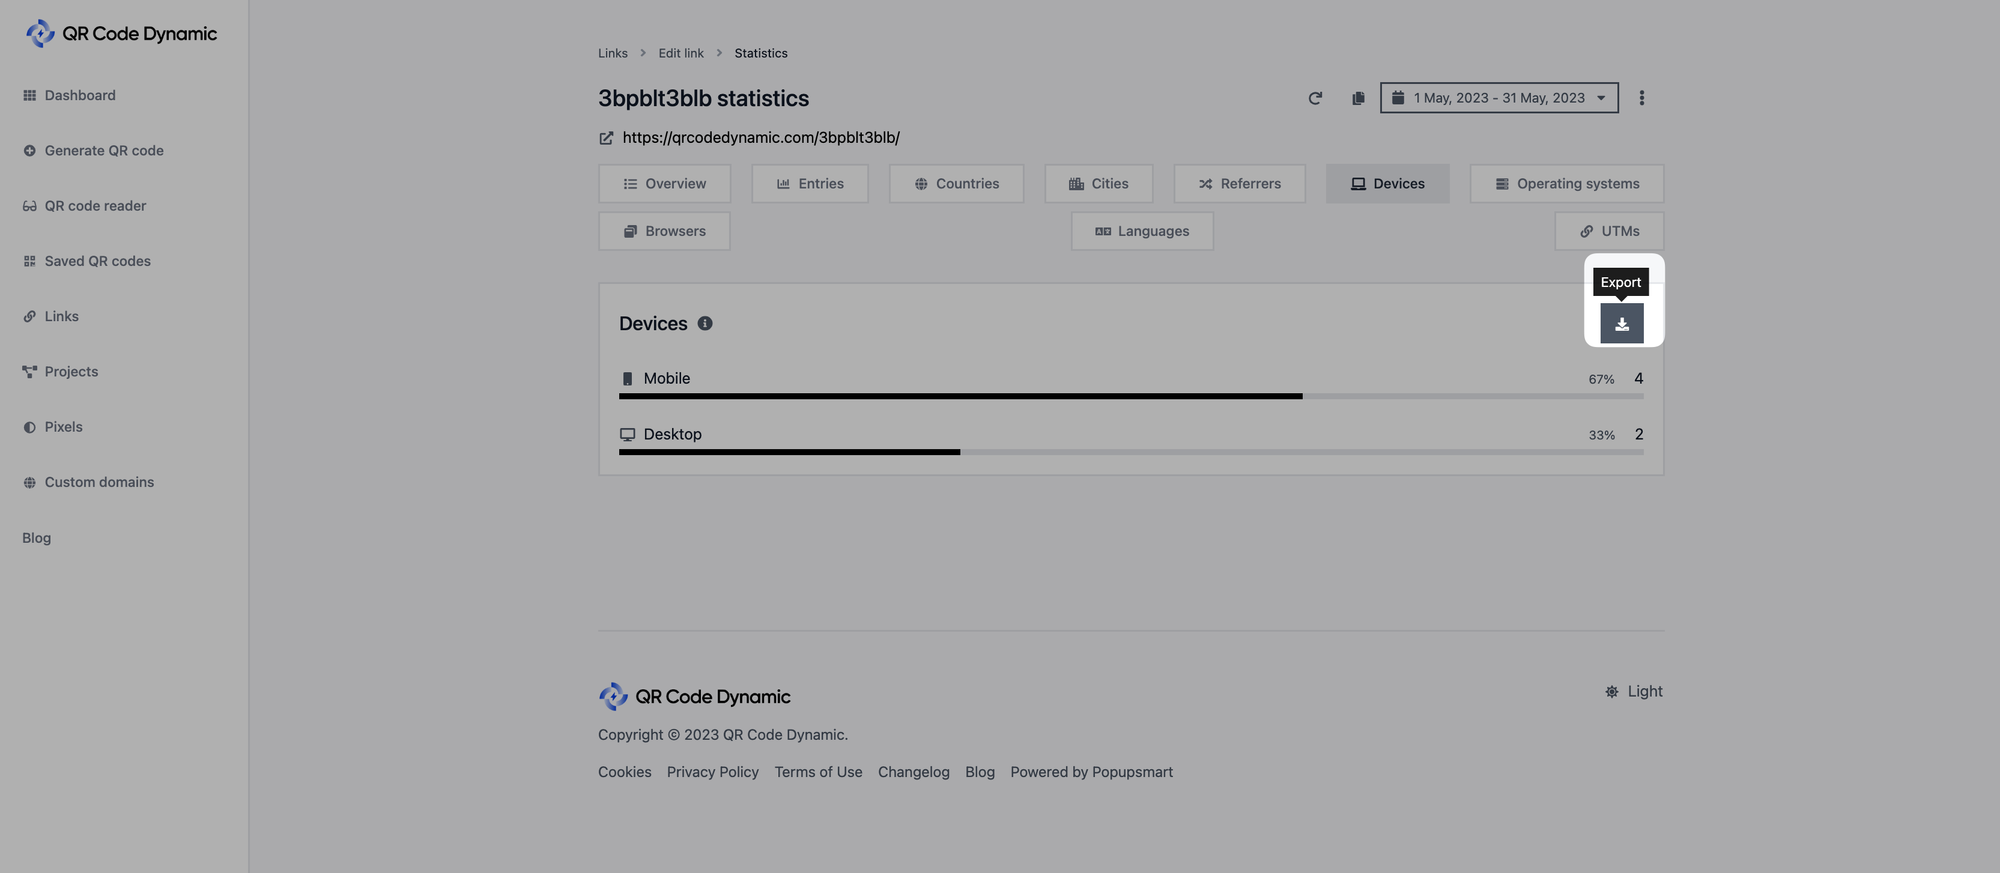
You can export each metric by clicking the export button, as shown above.
Available formats for exporting statistics are CSV and JSON, so you can choose the one that suits your needs.
That's all! By following these steps, you can easily access and understand the metrics available on the statistics page. Then, utilize these metrics to measure the success of your campaigns, optimize your marketing efforts, and drive better results.
If you have any questions about metrics on the statistics page, feel free to ask us!